Free Fishbone Diagram Template
Download this FREE Fishbone Diagram Template to help with your problem solving.
This type of cause and effect diagram is one of the more useful project management tools and techniques.
These project planning tools are also known as Fishbone Charts or Ishikawa Diagrams. They are used for problem solving and brainstorming. They help identify root causes so that appropriate actions can be taken.
This page will provide specific instructions on how to fill out my fish bone diagram template. If you need more general information, check out my Fishbone Diagram page.
To get started, make sure you've downloaded the template. Just click on the image below to download.
A few notes about the template...
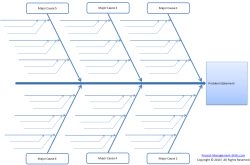
- The diagram is fully formatted. You only need to type in the contents for each of the boxes or lines on the diagram.
- Data only needs to be entered in the yellow boxes. The diagram will update automatically based on the contents of the yellow boxes.
- If you want a blank diagram to fill in manually, simply delete all of the data from the yellow boxes, then print your diagram.
Step 1: Fill in your problem statement. This is the last cell in the User Entered Data column (yes, all the way at the bottom).
Step 2: Fill in each of the Major Cause Categories.
Step 3: Fill in each Cause for all of the Major Cause Categories.
Step 4: Fill in any Sub-Causes (i.e. Secondary Causes) for each Cause.
Step 5: Print your Fish Bone Diagram!
That's it. A fully formatted fishbone chart in 5 easy steps!
If you haven't done so already, download your own copy of my FREE Fishbone Diagram Template now...

Do You Want More Project Management Tips?
Subscribe to Project Success Tips, my FREE Project Management Newsletter where I share tips and techniques that you can use to get your Project Management Career off to a great start.
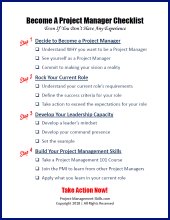
As a BONUS for signing up, you'll receive access to my Subscribers Only Download Page! This is where you can download my "Become A Project Manager Checklist" and other project management templates.
Don't wait...
New! Comments
Have your say about what you just read! Leave me a comment in the box below.